How to View Revenue by Class Type
See which classes and appointment types are generating the most revenue.
Steps
- Navigate to: Reporting > Reports, then choose the Revenue category.
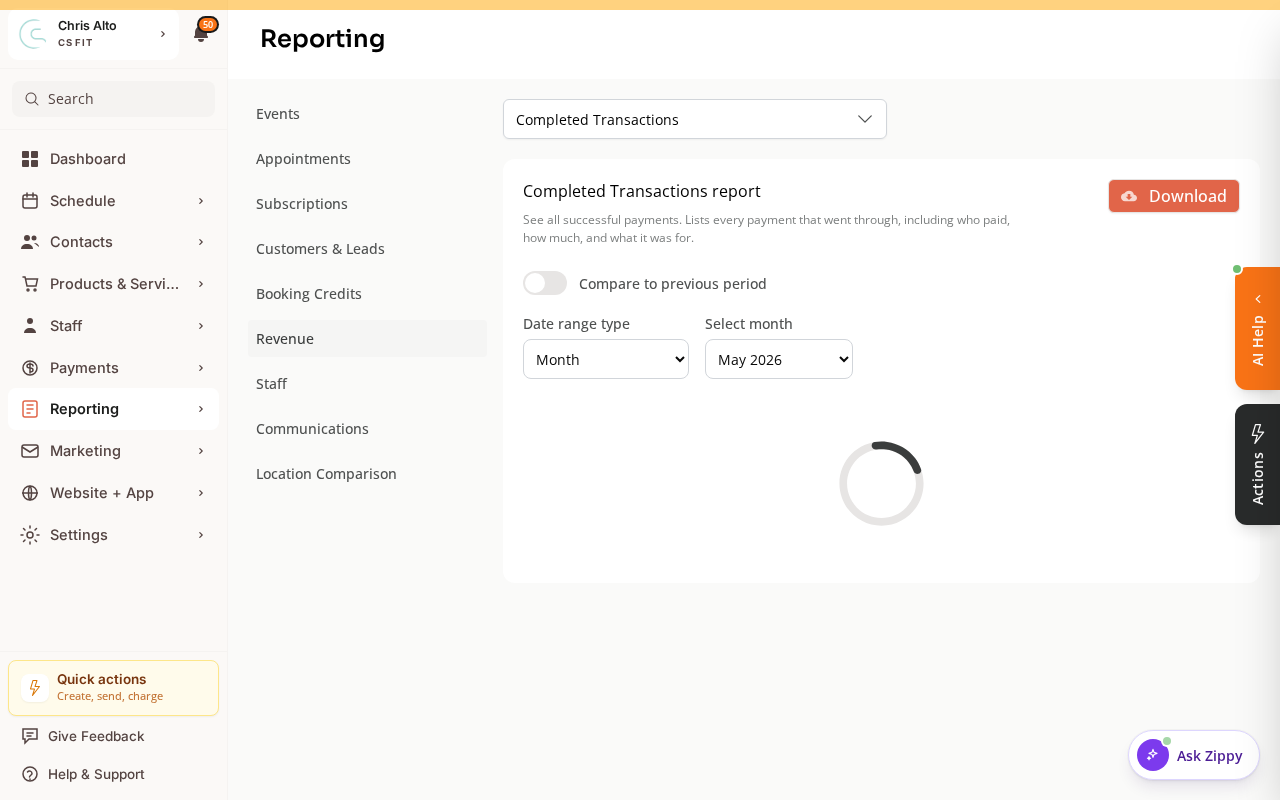
- Pick the revenue report you want (e.g., Completed Transactions / Revenue by Product).
- Set the date range (e.g., last 30 days, last quarter)
- Click: Run / Generate
What You Can See
| Metric | Meaning |
|---|---|
| Class/appointment type | Which service generated the revenue |
| Total revenue | Gross revenue from that class type in the period |
| Number of sessions | How many sessions ran |
| Average revenue per session | Revenue efficiency |
| Top performers | Which classes make the most |
Exporting
- Click: Export or Download CSV
- Use in your own spreadsheet for custom analysis
On Mobile
Same steps — reporting works on mobile browser.
Tips
- Compare periods: Run the same report for two different periods to see which classes are growing and which are declining.
- Drop-in vs. subscription revenue: Some reports may separate drop-in revenue from subscription revenue — useful for understanding which classes attract which payment types.
Troubleshooting
Revenue report isn’t showing some class types. Check the date range — if classes ran outside the selected period, they won’t appear. Also confirm that sessions were “completed” (ended in the calendar) for the revenue to be counted.
Need a hand?
Email our team at support@joinzipper.com and we'll usually reply within a few hours.
Was this article helpful?
Thanks for your feedback.